A/B testing refers to the process of displaying two variations of a web page to different segments of your website visitors. These variations are personalized content targeted to test which one drives more conversion. Using the results of A/B testing, you can determine the winning variation and then optimize your website for better results.
Google Optimize is a popular open-source website optimization tool that helps businesses run A/B tests on their websites and integrated analytics for smarter business decisions.
This guide will discuss the steps to implement A/B testing on a sample e-commerce website using Google Optimize. The goal is to determine which variant of the 'navbar' on the website is driving conversions - "sticky" navbar or "non-sticky" navbar.
Process overview: First, we will set up a sample “E-commerce” website and host it on ngrok. Then, we will link this website to Google Analytics and Google Optimize. Finally, we will run the A/B test in Google Optimize and analyze the results in Google Analytics.
Prerequisites
Steps for Execution
- Download the code and content of a sample website
- Import content to your stack using CLI
- Publish Content
- Create Delivery token
- Create Environment, Delivery Token, and Change Configuration
- Run the Sample Website
- Set up Google Analytics account
- Link sample website with Google Analytics
- Set up A/B testing in Google Optimize
Download the Code and Content of a Sample Website
To help you quickly get started with the integration, we have already created a sample website. You can download the code and content for the same from the following link:
Download Code and Content
Upon clicking the above link, you will be able to download a folder that contains the source code and content schema of the sample e-commerce website.
Note: Unzip the content file located inside the stack-content folder, and note down its path as we will need it in the next step.
Import Content to your Stack Using CLI
The schema of our sample e-commerce website can be imported to your stack either by using the import and export scripts or by using the Contentstack Command-line Interface (CLI). In this example, we will be using the CLI as follows:
- Install the Contentstack CLI:
npm install -g @contentstack/cli
- Add a Management token to the session:
csdx auth:tokens:add
Note: To add a management token to the CLI session, make sure you have first generated that management token in your stack as mentioned in the prerequisites. If not, generate the management token before running the above command.
- Import the content types, assets, and entries:
csdx cm:import -a <management_token_alias> -l <master_lang_of_stack> -d “<path>”
- -a: Name/alias of the management token you added in the session (in the above step 2)
- -d: Path of the unzipped “content” folder, downloaded in the previous step, which contains subfolders such as entries, content-types, etc.
Example: csdx cm:import -a mgmt -l en-us -d C:\Users\John Smith\Downloads\google optimize\stack-content\contentIn the above example, mgmt is the alias given to the Management token, and the content folder contains folders for entries, assets, content_types, environments, and locales.
Note: If you encounter any error while executing this command, try enclosing the path within quotes.
Now that you have imported the required content, let’s proceed with configuring the sample e-commerce website.
Publish Content
After importing the content to your stack, publish it on an environment. By default, the “production” environment gets imported through the above step. If you want, you can create an environment and publish the content on that environment.
Note: If after importing the content, the entry is unable to get published (for some reason), recheck the entry and ensure all required fields are filled, and then publish the entry on the “production” environment.
Create Environment, Delivery Token, and Change Configuration
If you want to publish the imported content on another environment, for example, "development," you will first have to create that environment.
Then, create a delivery token for the “production” environment or the one you just created and make a note of this token.
Now open the downloaded code in a code editor of your choice and go to the config > default.js file. Add your stack credentials (API key, delivery token, and environment name) in the file and save the file.
Your default.js file should look have similar to this:

Run the Sample Website
Once you have made changes in the configuration file, it's time to run our sample app. To do so, perform the following steps:
- Open the terminal, point it to the root directory of your code folder, and install the required dependencies using the following command:
npm install
- To run this sample website, staying inside the project root directory, run the following command:
npm start
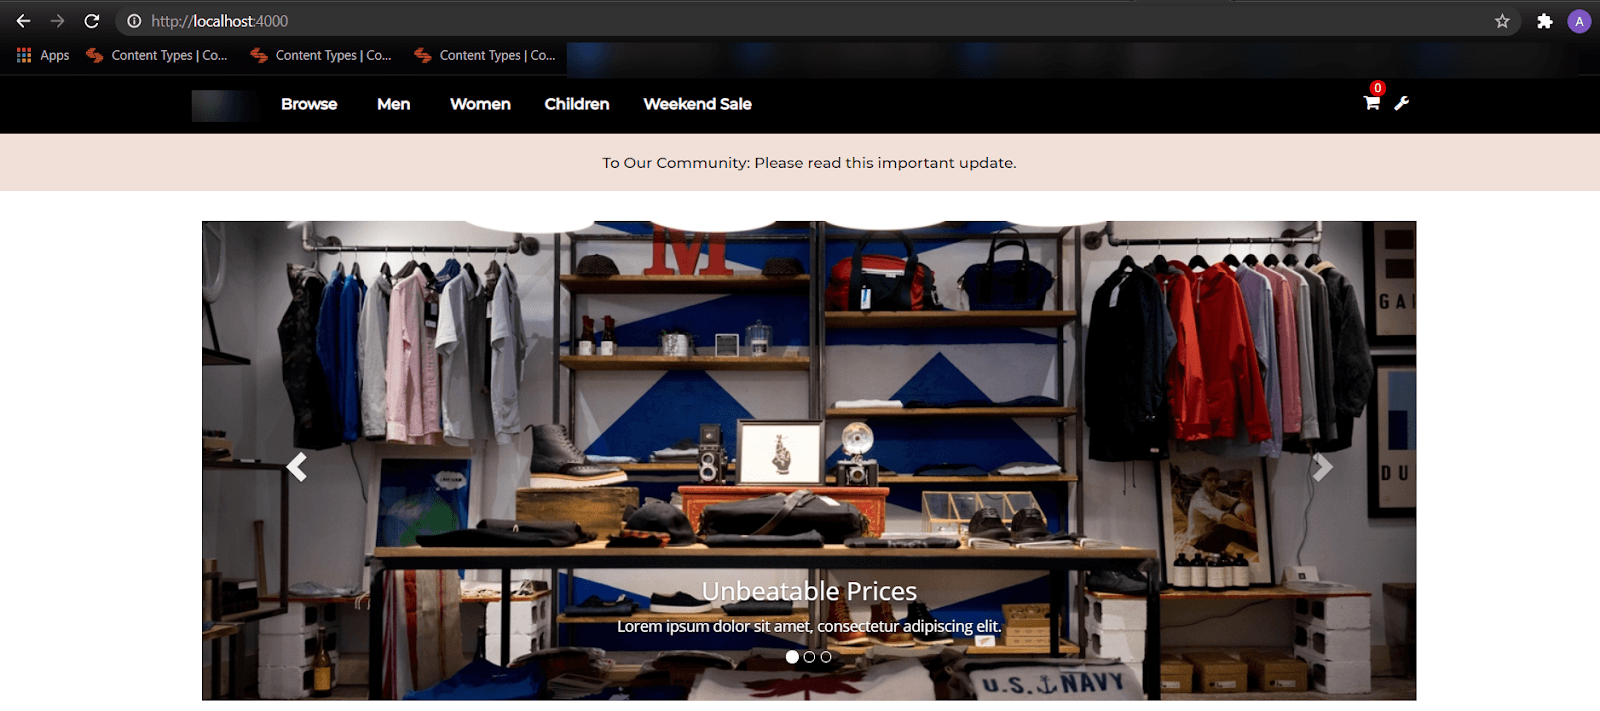
Your website will run on the localhost port 4000: http://localhost:4000/ as shown below:
- As we cannot add localhost’s URL for setting up Google Analytics on our sample website, let’s host it using Ngrok. To do so, open the ngrok’s terminal, and run the following command:
ngrok http 4000
You should get a ngrok URL similar to the one shown below:

Make a note of this URL as you will need it when linking Google Analytics with this sample website.
Warning: Do not close the ngrok URL window as we need it to run for the entire process and to collect the results of our testing.
Next, to personalize the content using Google Optimize, we need to add this sample website to Google Analytics. Let’s proceed with setting up a Google Analytics account.
Set up Google Analytics Account
To get started with Google Analytics, perform the following steps:
- Visit the Google Analytics website and select either of the following options:
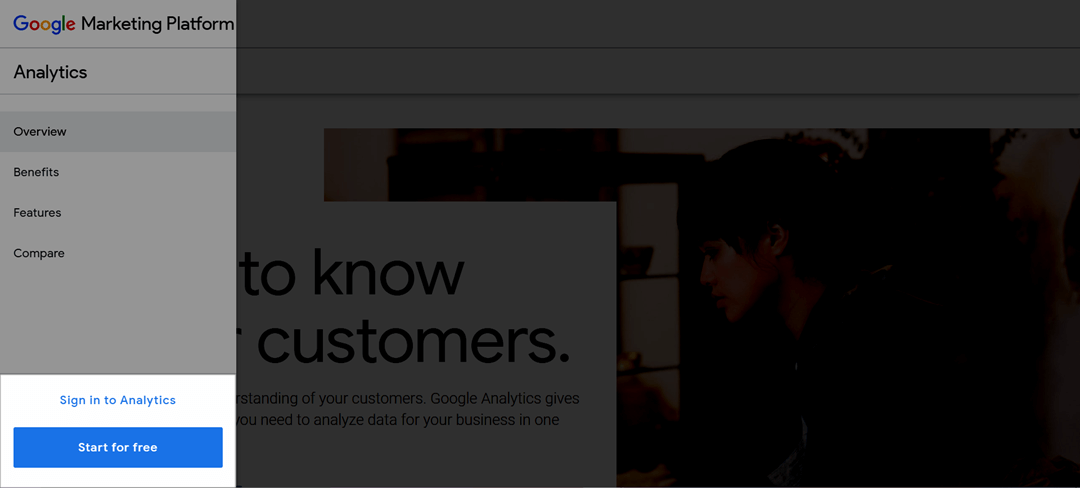
- Start for free: To create an account.
- Sign in to Analytics: To sign in to your account.
The next screen will introduce you to a "Demo" account of Google Analytics.
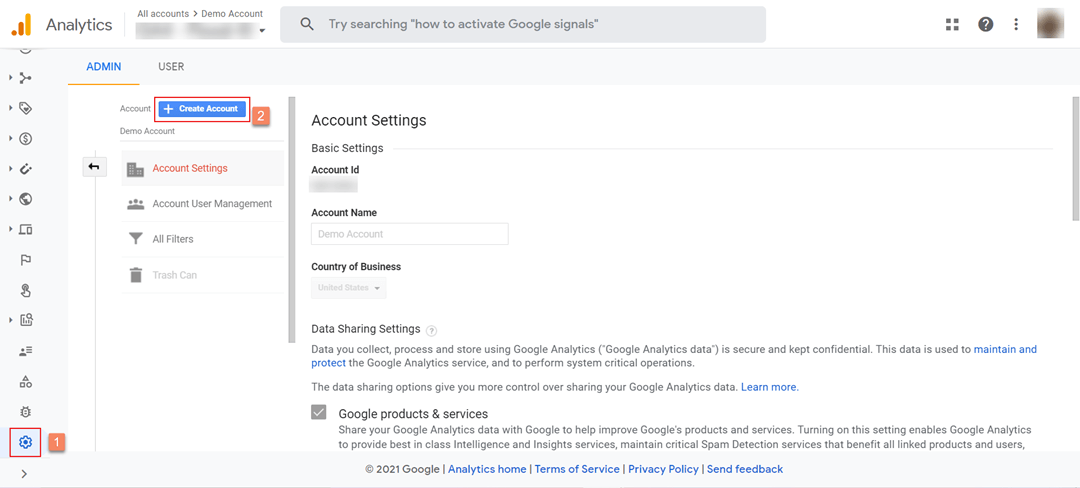
- From the left navigation panel, click on the “Admin” icon (gear icon) and click the + Create Account button.
- Next, in Account setup, provide an Account name for example “Sample Project.”
- The Account Data Sharing Settings section lets you control the access to data with the Google team. By default, all the options are selected, but you can select/deselect any if you want. For this tutorial, let’s keep this section as it is and click on Next.
- A “Property” in Google Analytics represents specific web/app data.
In the Property setup step, provide the Property name, let’s say “E-commerce website.”
- Select the Reporting time zone as per your requirements from the available options. Also, select the Currency of your choice.
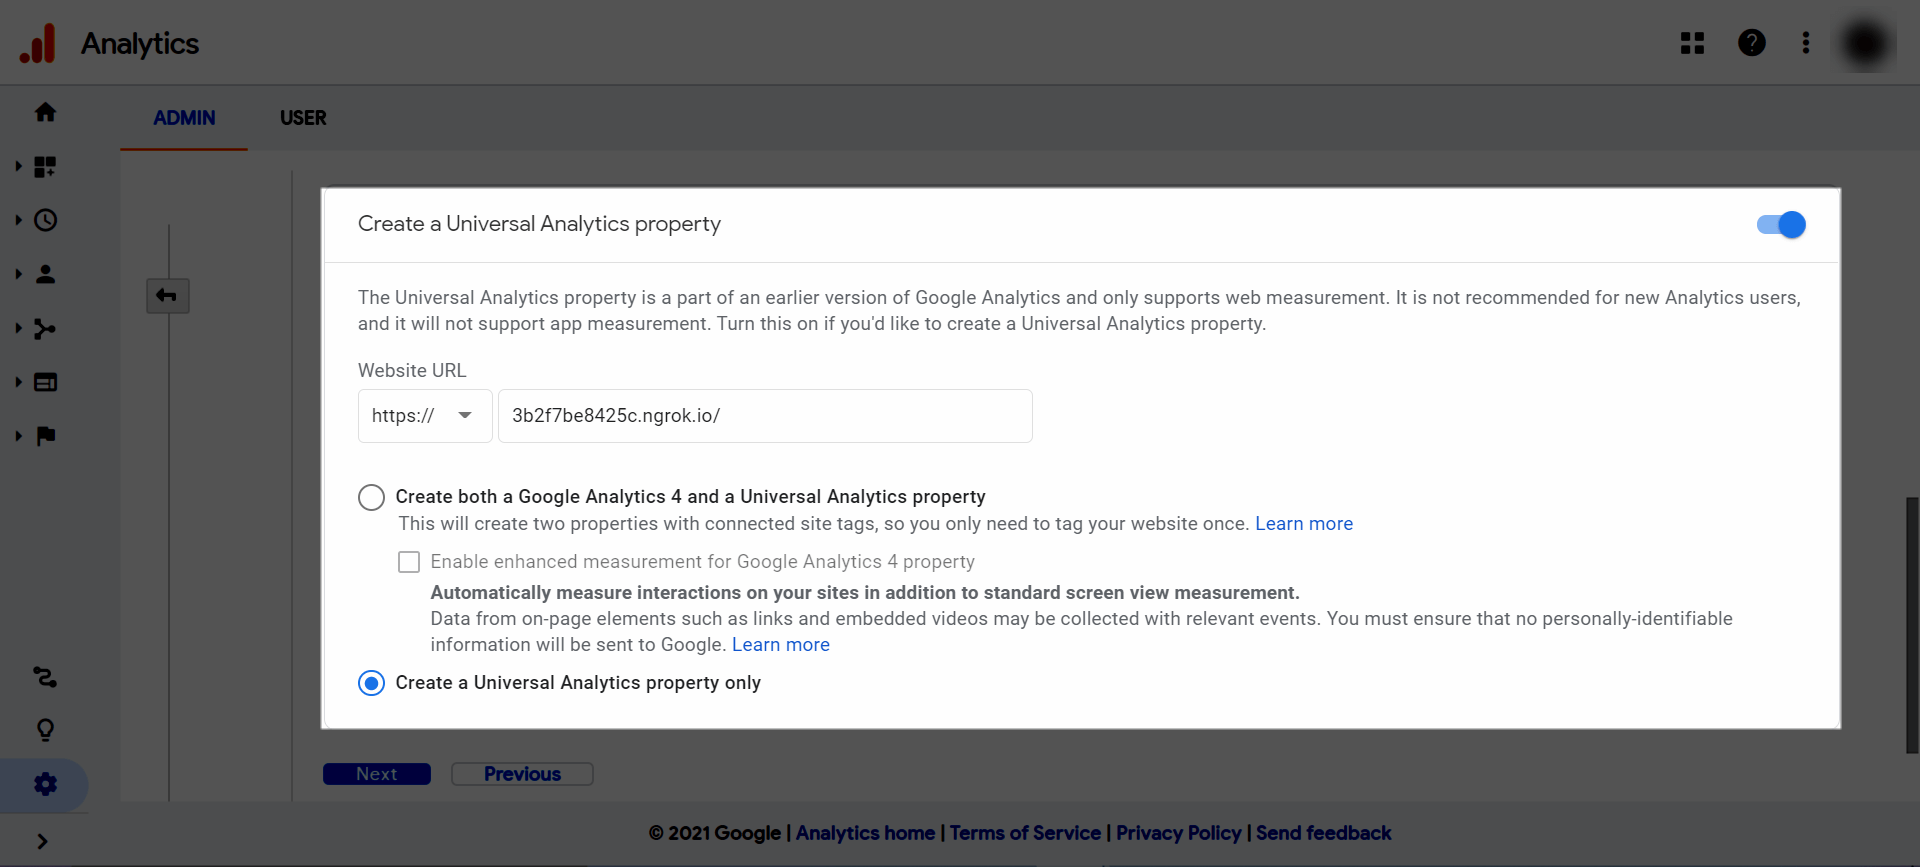
- Expand the Show advanced options section and enable the Create a Universal Analytics property option.
- Under the Create a Universal Analytics property section, provide the Website URL (in our example it is the ngrok URL that we generated above). Then, select the Create a Universal Analytics property only option.
- Click on Next, and in the About your business step, provide the data about your business.
- Click on Create and accept the necessary terms as denoted in the Google Analytics Terms of Service Agreement window.
- Upon successful creation of your account, you will receive the Tracking ID.
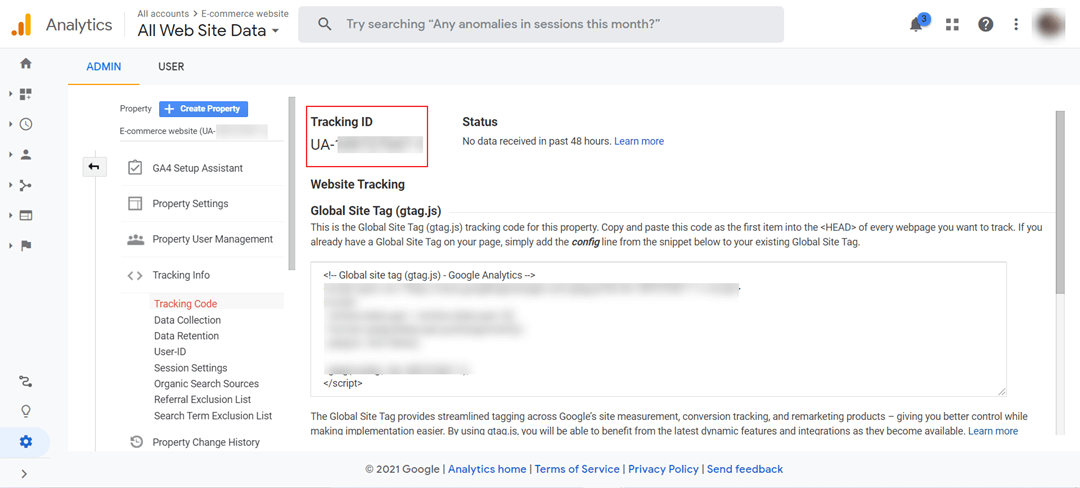
Make a note of this ID as we’ll need it to link our sample website with this Analytics account.
You’ve successfully created an account and property in Google Analytics. Now let’s proceed with linking your website with Google Analytics.
Link Sample Website with Google Analytics
To link the sample website with Google Analytics, perform the following steps:
- Open the sample website code, go to the default.js file (which is inside the config folder), and add the tracking ID in the trackingId key.
- Save the default.js file, and restart the localhost server by running the npm start command in the terminal of our project’s root directory.
Warning: Do not close or stop the ngrok server as we have submitted its URL in the Google Analytics account. Stopping the ngrok server will result in losing the connection between our sample E-commerce website and Google Analytics.
To verify the linking between the sample E-commerce website and Google Analytics, hit the ngrok’s URL in the browser.
Next, navigate to the Realtime section (under REPORTS) from the left navigation panel in your Google Analytics account.
Click on Overview and observe the user count.
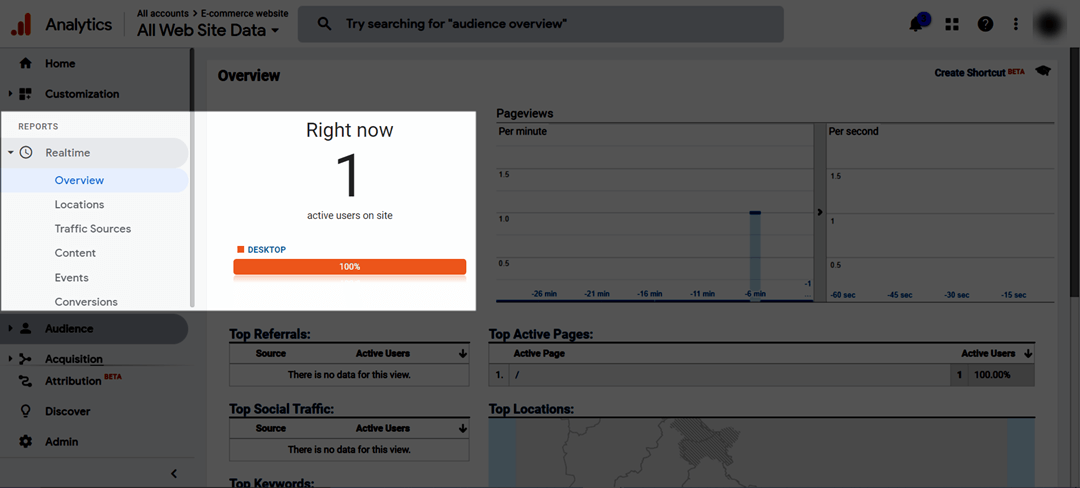
Now that your Google Analytics shows 1 user, it means that the linking is successfully established. Next, we will set up a Google Optimize account and link it with a Google Analytics account.
Set up A/B testing in Google Optimize
To set up a Google Optimize account for personalizing our content, perform the following steps:
- Go to https://optimize.google.com/ and click Get started.
- On the next screen, select your preferences for staying updated with Google Optimize and click on Next.
- Accept the terms and conditions as per your preference and click on Next.
- Google Optimize creates a default container with the name My Container. You will be on the Experiences tab by default.
- Click on Settings on the top right corner.
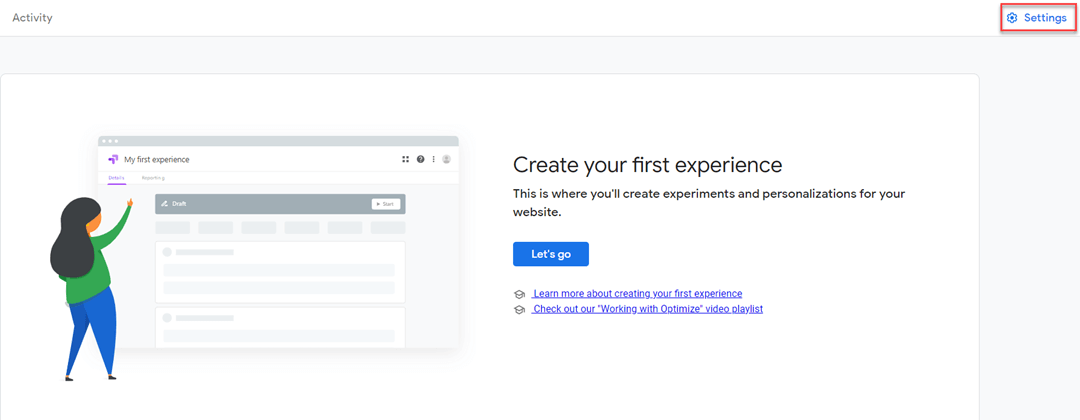
- On the Container settings screen, copy the container ID and paste it as the value of the optimizeId key inside the default.js file of the sample code and save it.

- Now back to the Container settings page, click on the Link to Analytics button.
- On the Link a property page, select the property (we created in Step 4 for linking this Optimize account with the Analytics property) from the Select a property dropdown and click on Link. Ensure All Web Site Data is checked for the Views option.
- As soon as that is done, you can see the property linked under the Measurement section. Close the Container settings page and you will be directed back to the My Container screen.
- Let's now create our first experience by clicking on the Let's go button:
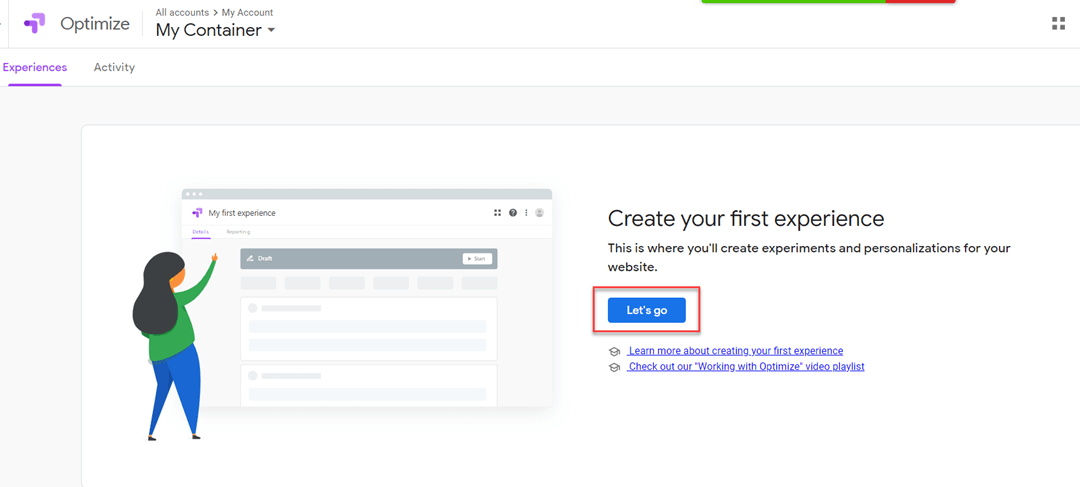
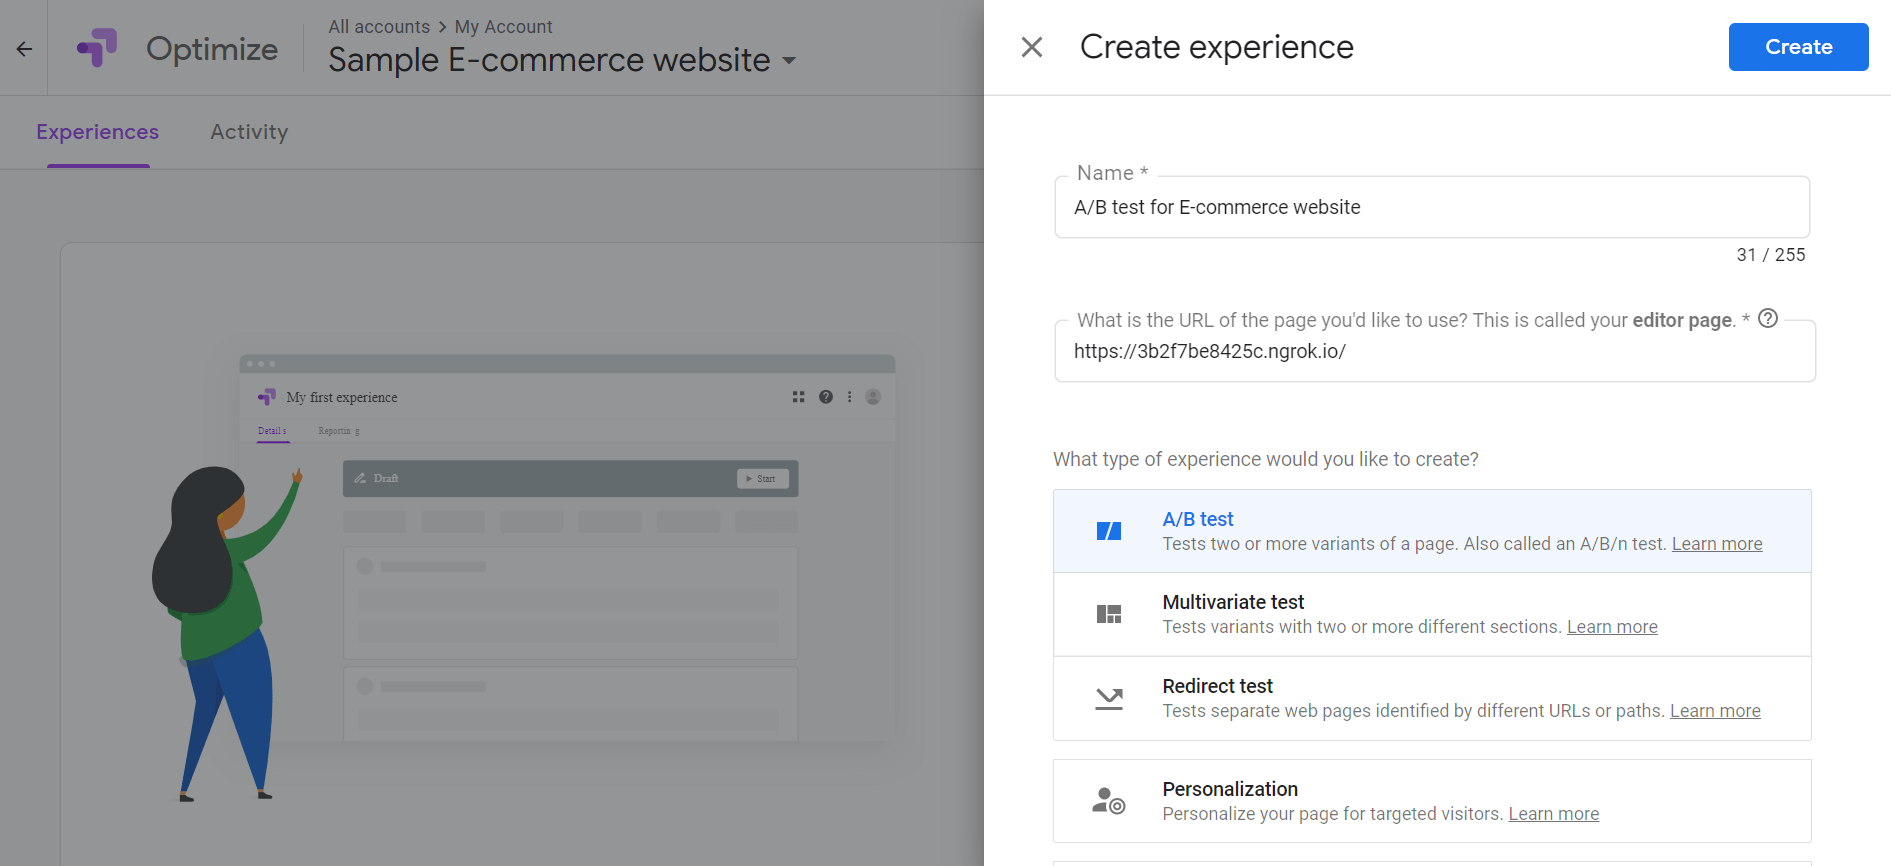
- On the Create experience screen, perform the following steps:
- Provide a Name of the experiment, for example, “A/B test for E-commerce website”
- Enter the URL of the page where we want to perform the test. In our case, enter the website’s URL generated through ngrok.
- Select A/B test and click on the Create button.
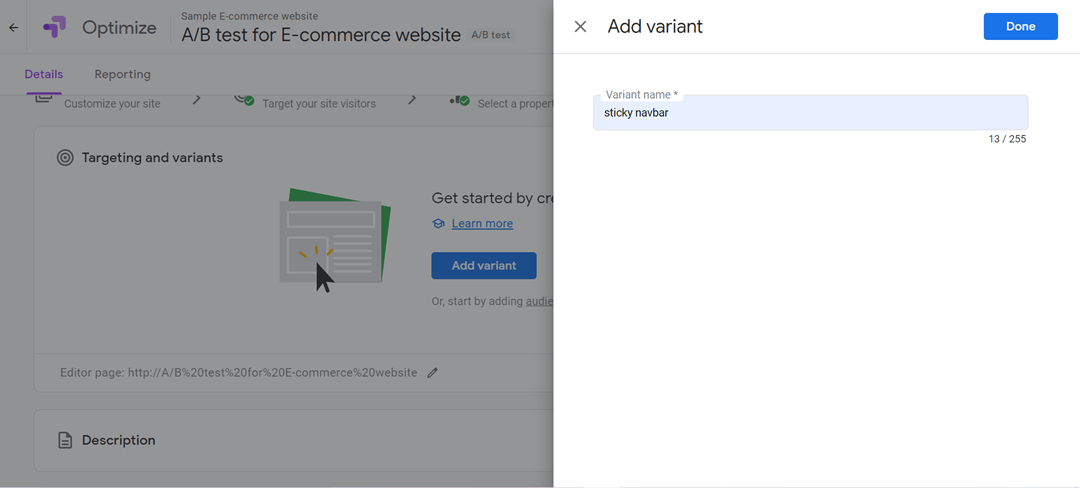
- Next, we will be testing two variants of our homepage, the first one will be a default one, so we have to add one more. So on your experience page, you will be on the Details tab by default. Under the Targeting and variants section:
- Click on Add variant.
- Provide a name to our first variant, for example, “sticky navbar” and click on Done.
- For this tutorial, we’ll keep the Page targeting and Audience targeting sections to their default settings. However, you can configure these sections to set your custom targets.

- Scroll down to the Measurement and objectives section and note down the Experiment ID. To link this experiment with our content, add this ID to our entry in Contentstack. To do so, perform the following steps:
- Open a new tab, log in to your Contentstack account and go to the stack in which you have imported the content in Step 2.
- Open the Experiments entry of the A/B Tests content type and add the ID in the Experiment Id field.
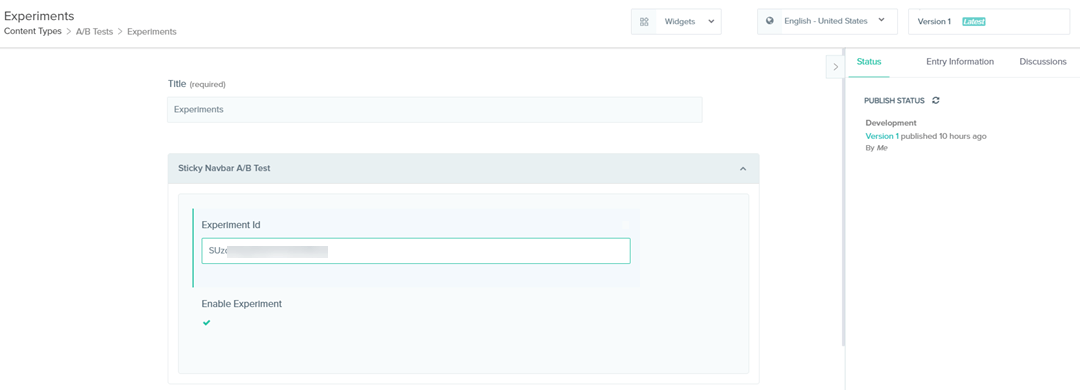
- Save and publish this entry, and restart the localhost server by running npm start in the terminal.
Warning: Do not restart the ngrok server. Doing so will break the connection between Google Optimize and our sample E-commerce website.
- Coming to our Optimize setup page, in the Objectives section, we will set the website functionality we want to optimize. For this tutorial, we will be targeting to optimize bounces happening on the webpage. To do so, click Add experiment objective dropdown -> Choose from list -> Bounces.
- To verify that Google Optimize is correctly installed in the sample E-commerce website, first, you need to install the Google Optimize extension in your browser. After the extension's installation, scroll down to the Settings section and click on the Check installation button.
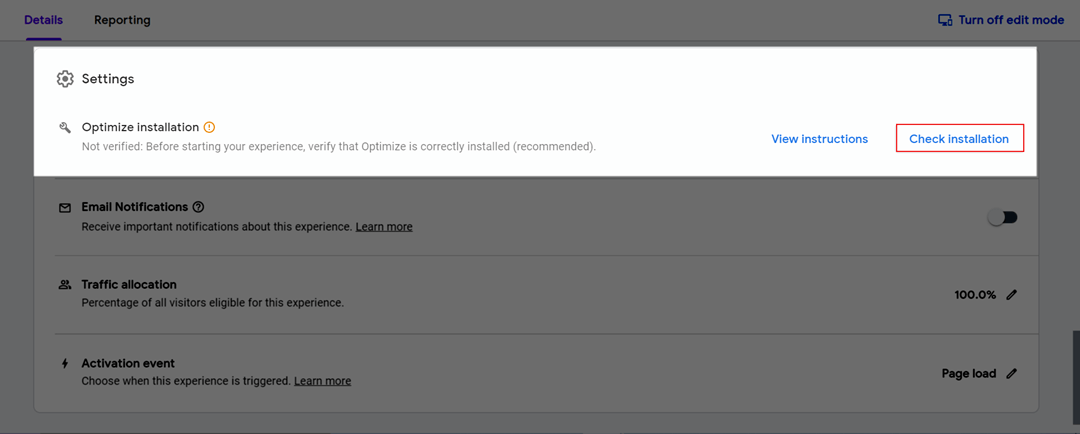
This will open the sample website in the browser giving you the message whether Google Optimize is properly installed in the website or not.
.png)
- Once you get a successful message of Optimize installation, go back to your experiment’s page (by clicking on theBack to experience button in the success message), click on the Start button, and confirm to Start the experiment.

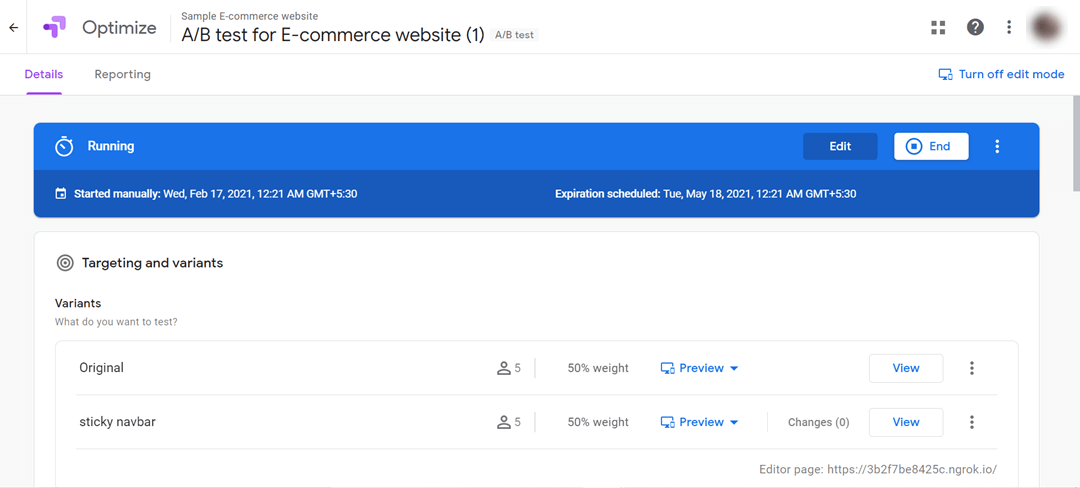
- Once the experiment starts and Optimize starts collecting the data, we will see the following screen:
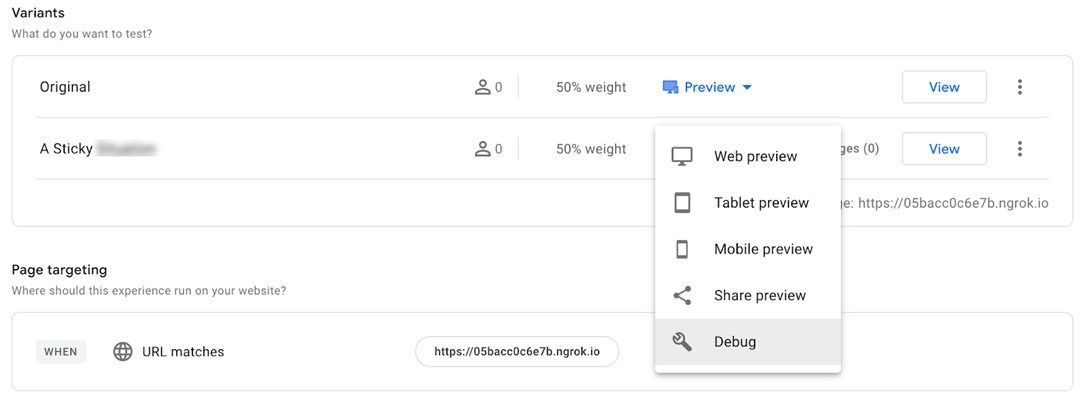
- To confirm whether the two variants of the home page are working fine, click the Preview option and select Debug, as shown below:
- A new tab opens, displaying the homepage. To check the variant's information, check out the variant number at the bottom of the page, as shown in the image below:
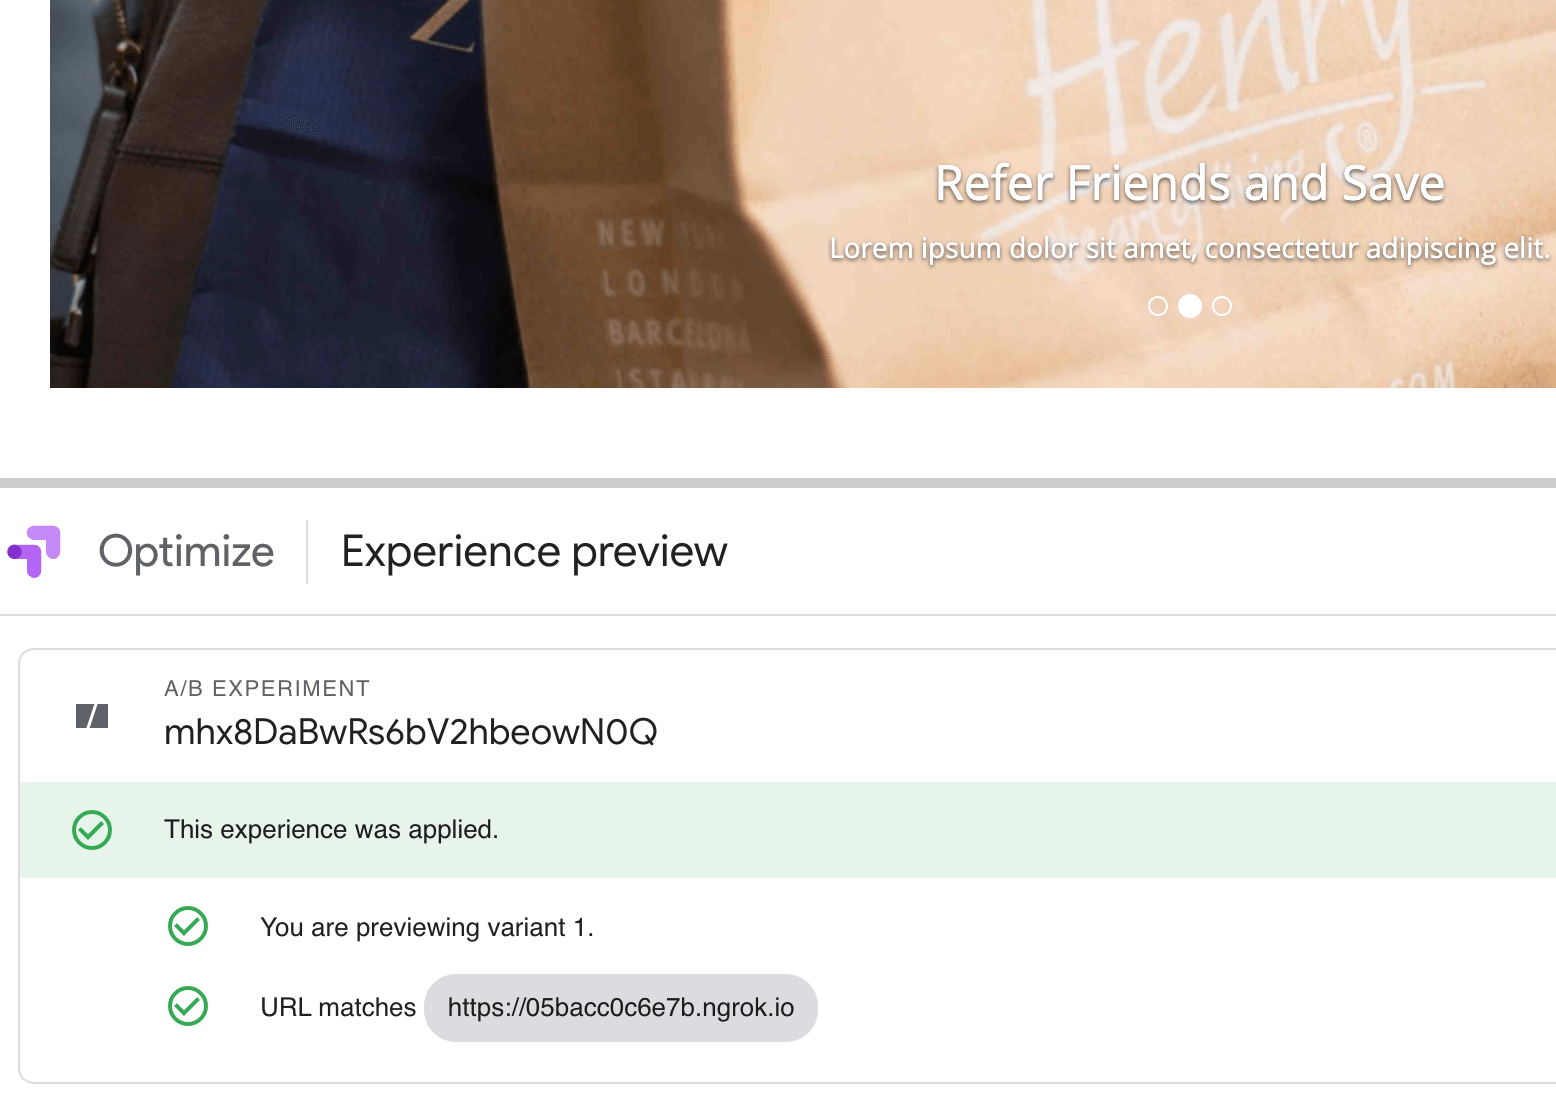
Note: If you cannot view the variant details, make sure you have correctly installed the Google Optimize chrome extension.
It takes some time (even a day) for Google Optimize to gather the results, so make sure to keep the experiment running. After a day, you can view the initial analysis and reports of this ongoing experiment by scrolling down to the Measurement and objectives section and clicking on View reports in Analytics.
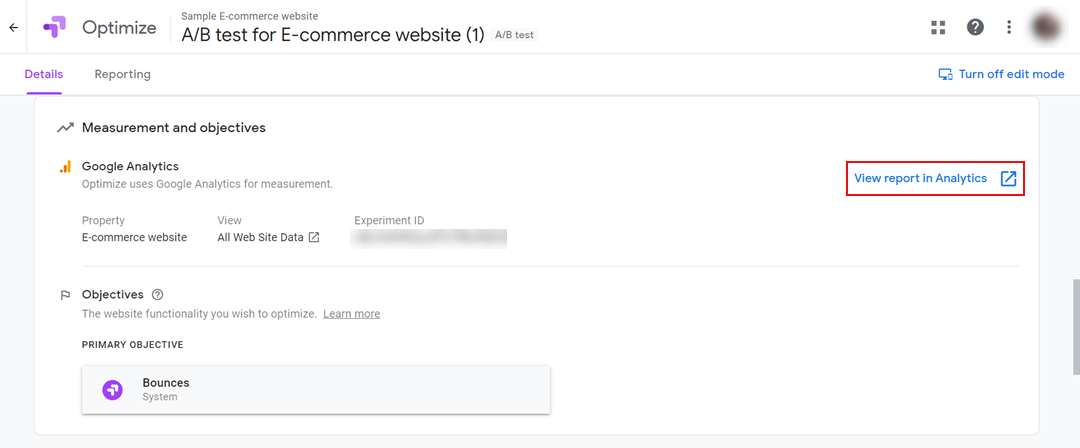
A new tab opens for Google Analytics. Here, you can view the performance of the two variants of the home page. As we are evaluating the bounce rate on two variants of our home page, we can see the metrics as seen in the image below:
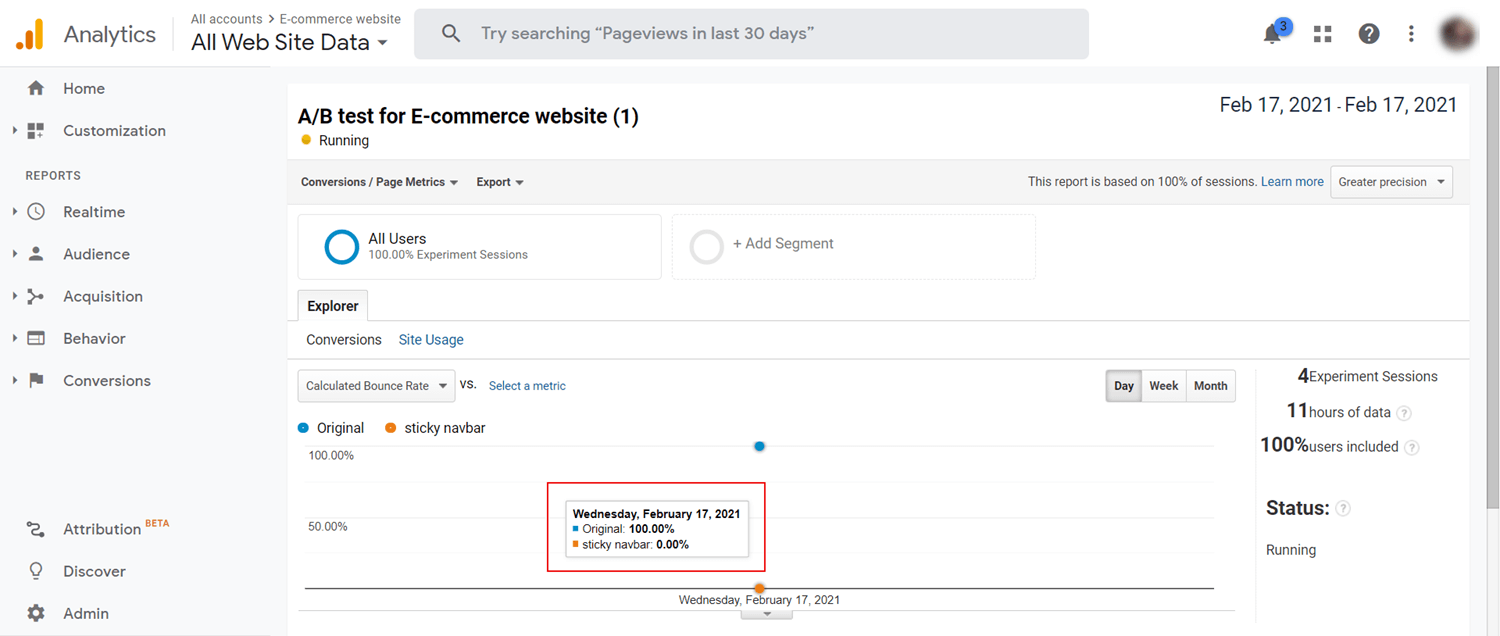
Note: It might take a day for you to view the initial results of your variations in your Google Analytics account.
The above image shows that the home page with a “sticky” navbar counts less bounce rate as compared to the “non-sticky” (original) navbar. Using such analysis, we can determine the appropriate version of our home page.
Conclusion and More Resources
You can do a lot more with Google Optimize A/B testing and Contentstack than the example that we have shown here. You can create different banner variations of your homepage and see which one performs better, and so on.
To leverage the power of Google Optimize for analyzing users’ behavior on your website by personalizing the website’s content.
Refer to this Personalization resource to learn more.
If you want to implement A/B testing on your website using Optimizely, refer to the A/B testing using Optimizely guide.


.png)


