Was this article helpful?
Thanks for your feedback
The organization settings page provides information related to the number of users, the usage, and the analytics.
To access the analytics for your organization, log in to your Contentstack account and perform the following steps:

The example in the below image displays 14/1000 users. The numbers stand for ‘“Number of users added to the Organization” / “User Limit for the Organization”.

When users are removed from the stack, your Organization User List may reach a limit due to the number of inactive users. Therefore, removing inactive users from the organization list is advisable instead of the stack.
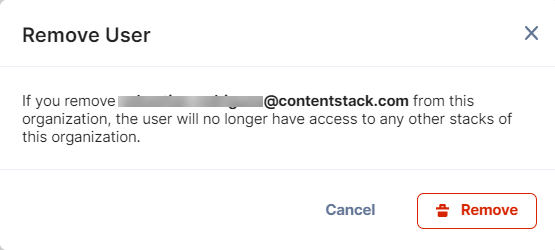
A user removed from an organization also loses access to all stacks it contains.
To remove an inactive user from the organization, log in to your Contentstack account and perform the following steps:


The Usage by Stacks section gives a quick overview of the usage of "API Requests/Bandwidth" and various entities in the organization’s stack.
To view the bandwidth and API requests usage by stacks in the organization over a period, log in to your Contentstack account and perform the following steps:

The Bandwidth section gives an overview of data usage in the form of a bar chart. The dates are mapped on the X-axis and the corresponding Bandwidth usage (in GB) is mapped on the Y-axis. Set the time frame of your choice and get the desired results as shown below:

Hover over any bar in your chart and you can see the corresponding bandwidth usage(in GB) for a specific duration.
The API Requests section illustrates the API utilization over a particular period, using a bar chart. Time is mapped on the X-axis and the corresponding API utilization is mapped on the Y-axis. You can set the time frame of your choice and get the desired results as shown below:

Hover over any bar in your chart to see the corresponding API utilization for a specific duration.
The Top URLs section highlights the most frequently hit API URLs, along with the number of times those URLs were called for a specific duration.

Using Filters, you can filter the data of the Usage Analytics and Tops URLs sections. You can retrieve data for a specific service, specific group, and specific duration.
Use the Services filter to view the usage of the data of specific services only. You can choose either a single service or all services at a time.

The Group By filter lets you view the usage data grouped by Daily, Weekly, or Monthly usage.

The Duration filter gives you quick options to view data of the last 30 days, last 14 days, last 7 days, or last 1 day. The Custom Range option lets you select a custom date range within the last 30 days as shown below:

Was this article helpful?
Thanks for your feedback