View Webhook Logs | Classic

Contentstack keeps a log of all the triggered webhooks in your stack.

To view the log of a webhook, log in to your Contentstack account, and perform the following steps:

  1. Go to your stack, navigate to the “Settings” gear icon, and select Webhooks.
  2. Click on the webhook to view its details. On that particular webhook page you will notice two tabs: Edit (to view/edit its settings) and Logs (to view its log).
  3. Click to open the Logs tab. Here you will view the following details:
    • WEBHOOK CALLED AT: Specifies the latest time when the webhook was triggered. Hover over the displayed time to get the actual triggered time.
      Webhook_log.png
    • CALL STATUS: Specifies the status of the triggered webhook whether it was successfully triggered (denoted by status code - HTTP 200) or any error has occurred (denoted by status code - 4XX and 5XX i.e., non 2XX)

      In case of a failure or if a session timeout occurs (webhook request timeout is 30 seconds), the webhook will immediately retry to send data to the destination URL again four more times. The interval time between two retries increases exponentially according to the retry attempt number.

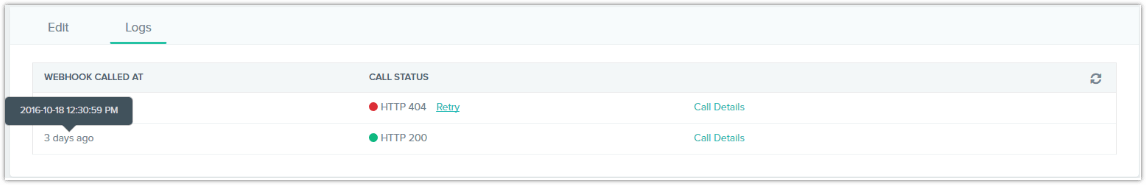
      Note: Contentstack follows an exponential retry policy when any webhook fails to send data to the destination server. Refer to the Webhook Retry Policy section to better understand how retries work.

  4. To view the details of the webhook call, click on the Call Details link. It will display the Request Details of the webhook call as well as the Response Details received.
    Webhook_Call_details.png

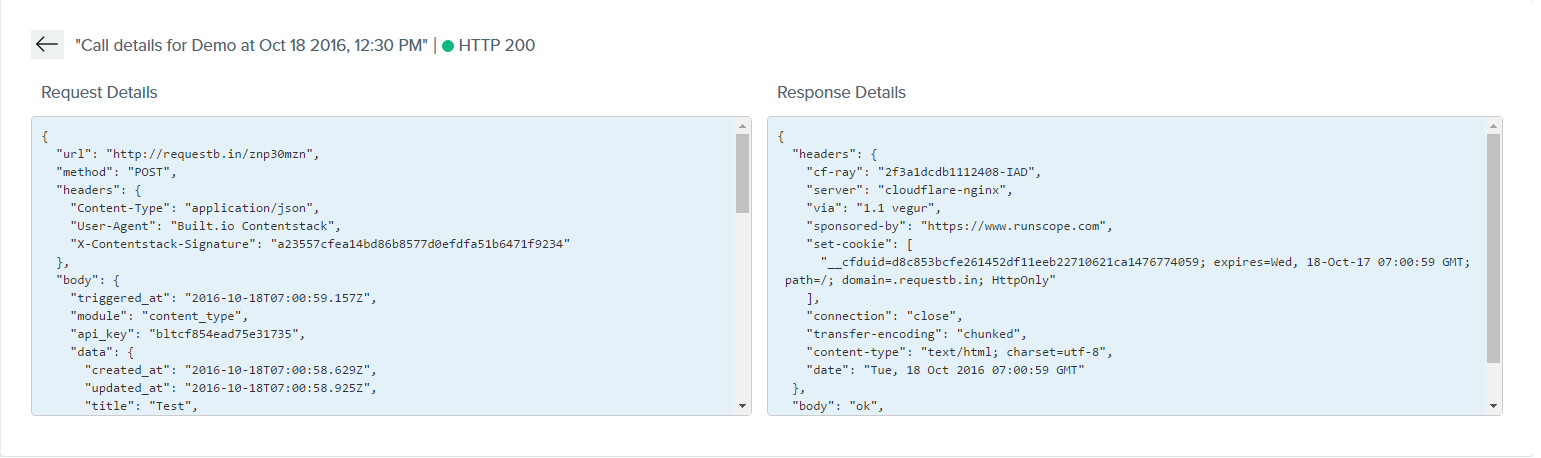
    Note: In the case of failed attempts, the Response Details section will display no data.

API Reference

To get webhook logs via API, refer to the Get executions of a webhook API request.

Was this article helpful?

Thanks for your feedbackSmile-icon

On This Page

^