Was this article helpful?
Thanks for your feedback
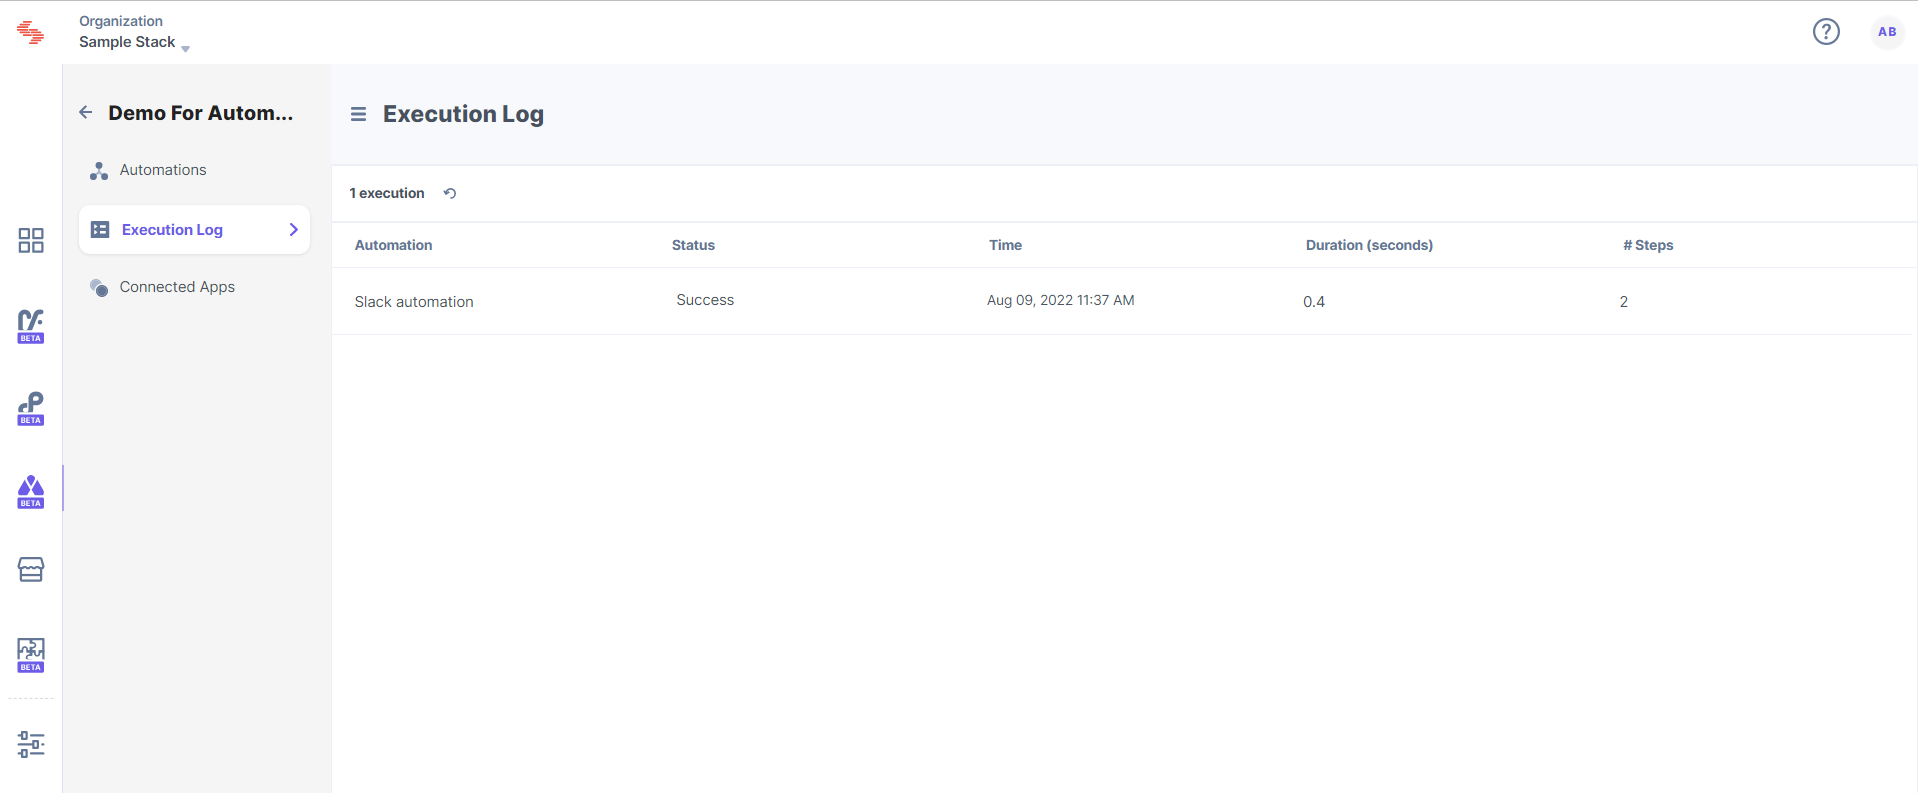
The Execution Log section helps you monitor the success status of your Automations. When you execute an automation, you will find the execution status under one of the following statuses: Failed, Processing, and Success.
To access it, click on Execution Log on the left navigation panel. You will see the details of the execution of the workflow. It shows the Time (date, time), Automation name, Status, Duration (in seconds), and the number of steps, i.e., the number of connectors configured and executed in the automation
Note: To view the logs, you must execute an automation.

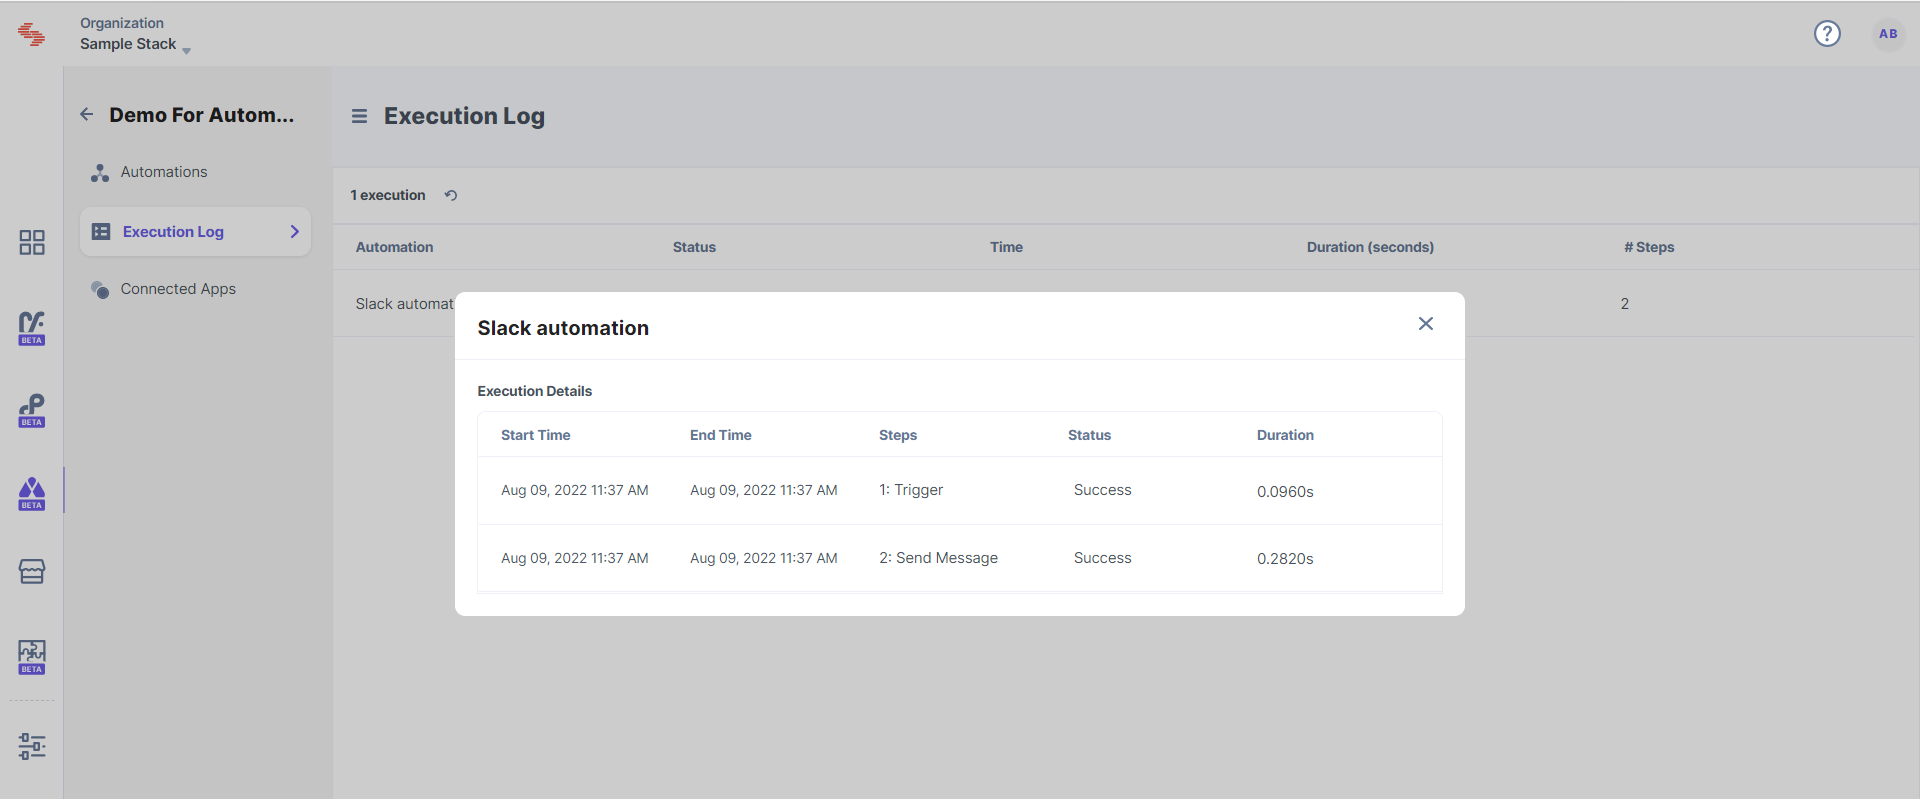
To view more details of a particular execution, click on a specific log. You will see a time-wise distribution of each step. If any execution was a failure, you would be able to see the details here as well

Was this article helpful?
Thanks for your feedback