Was this article helpful?
Thanks for your feedback
Content Type Visualizer Dashboard Extension offers a graphical representation of all content types, along with their fields, in a particular stack. This is similar to an ER diagram which is most commonly used in database management.
When you add the Content Type Visualizer extension to your dashboard, Contentstack users can easily get a diagrammatic view of all content types in a particular stack along with relationships between the content types, for example, one to one or one to many, and so on.
This step-by-step guide explains how to add the Content Type Visualizer Dashboard Extension for your Stack Dashboard.
Using this extension is a two-step process:
Let's discuss these steps in detail.
To add the Content Type Visualizer Dashboard Extension, log in to your Contentstack account and perform the following steps:
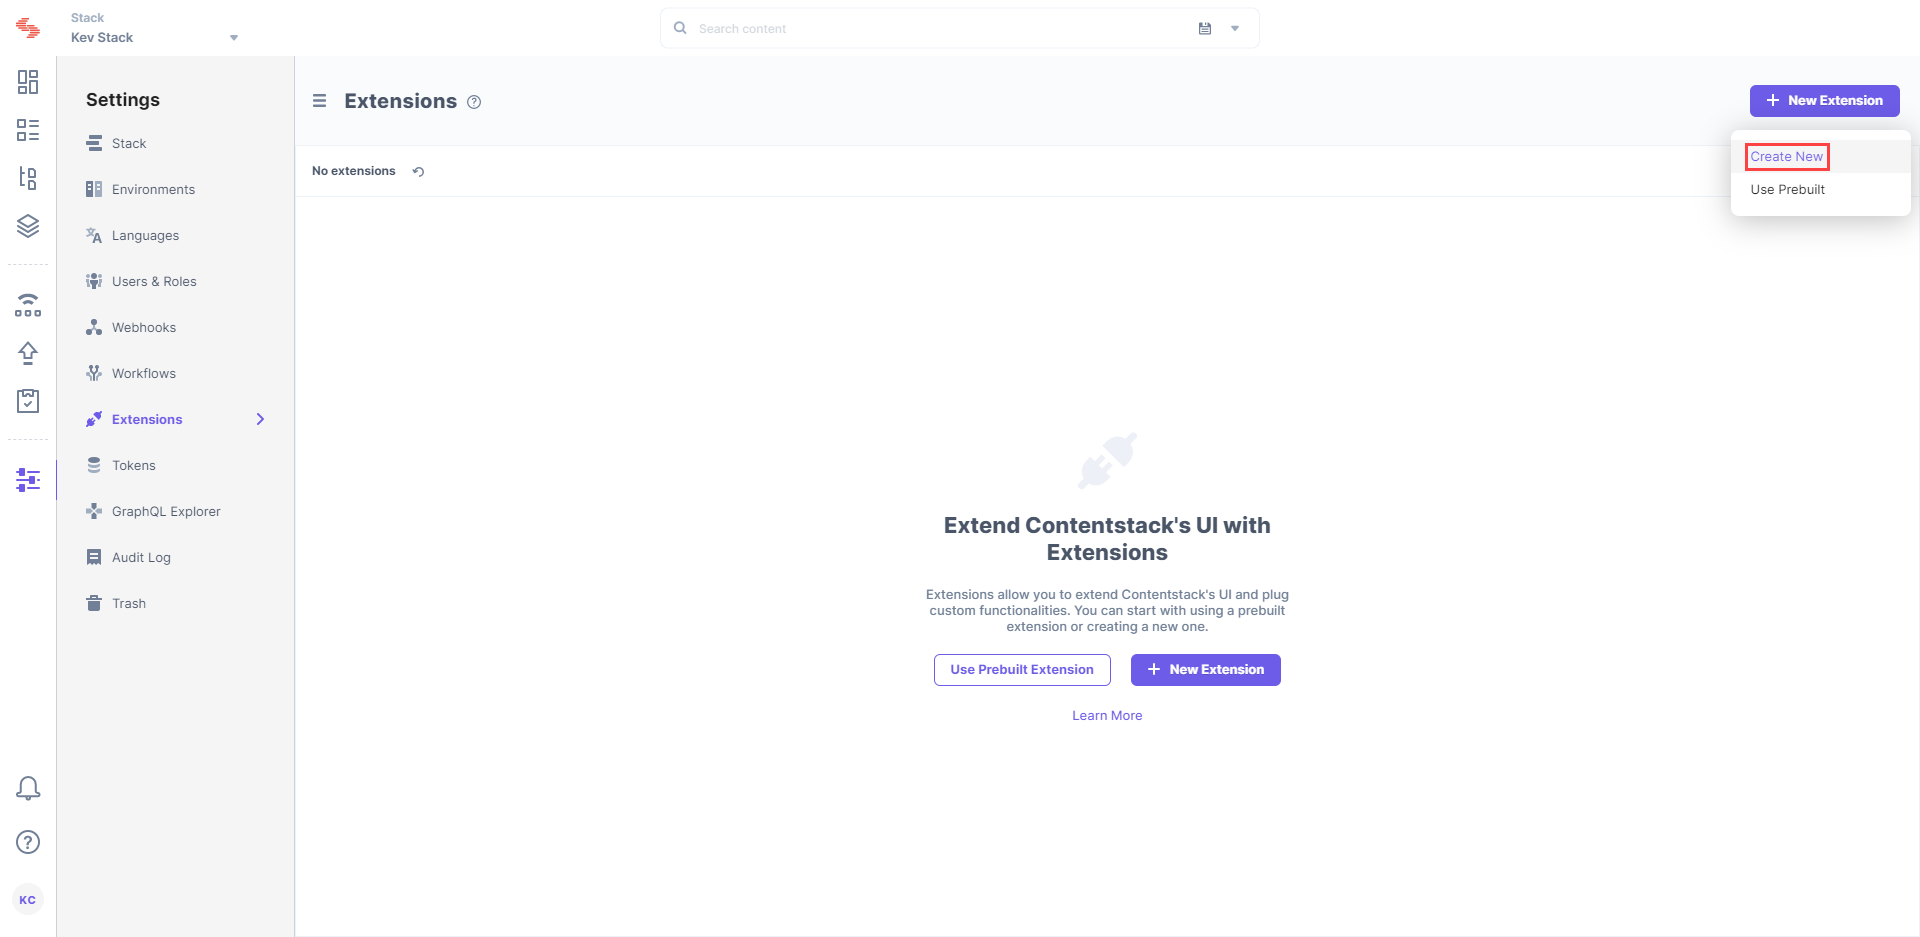
{
    "appHost": "app.contentstack.com"
}
For the Europe region, please use "eu-app.contentstack.com". Similarly, for Azure North America, use "azure-na-app.contentstack.com".Once you have added your Dashboard Extension, navigate to the Dashboard by clicking on the Dashboard button at the top of the left navigation panel.
You should be able to see the Content Type Visualizer Dashboard Extension added to your Dashboard as shown below:
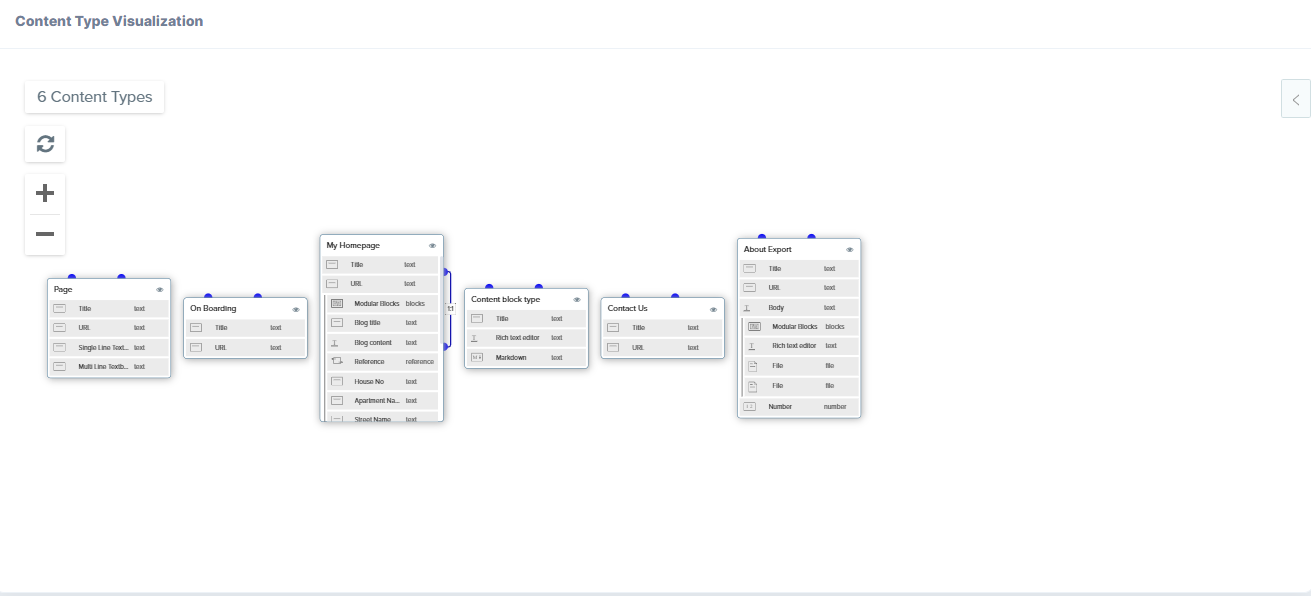
You can click on the refresh button to refresh the Dashboard Extension if new content types have been added and you want to reflect them in the extension. Moreover, you can zoom in or zoom out by clicking on the + and - icons respectively.
You can see the name of the content type, and clicking on a small icon to the right of the content type name helps you get the JSON preview as shown below:
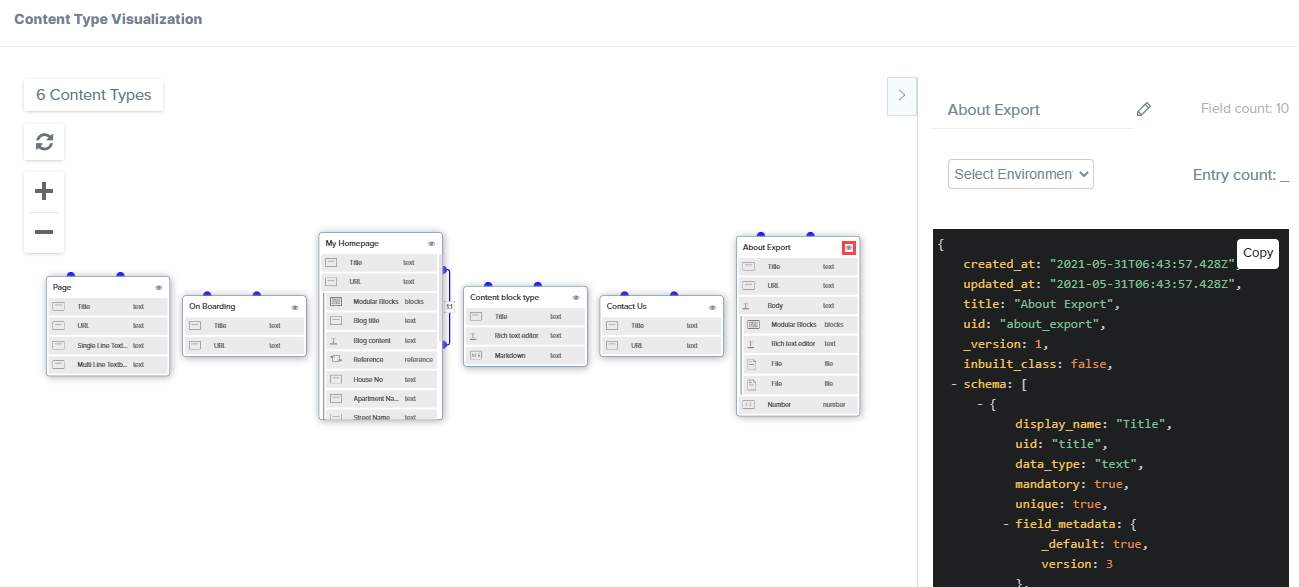
You can simply copy the JSON and use it as required. Field count: 5 in the following screenshot represents the number of fields in the selected content type. Also, below it, there is an entry count that represents the total number of published entries in that content type:
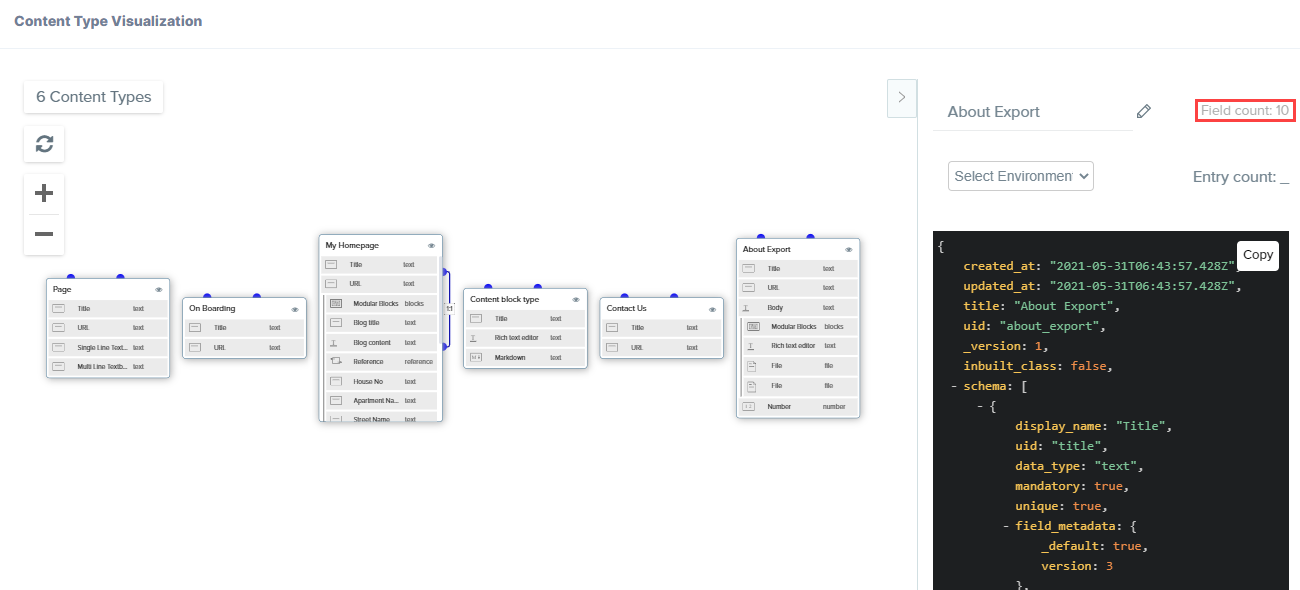
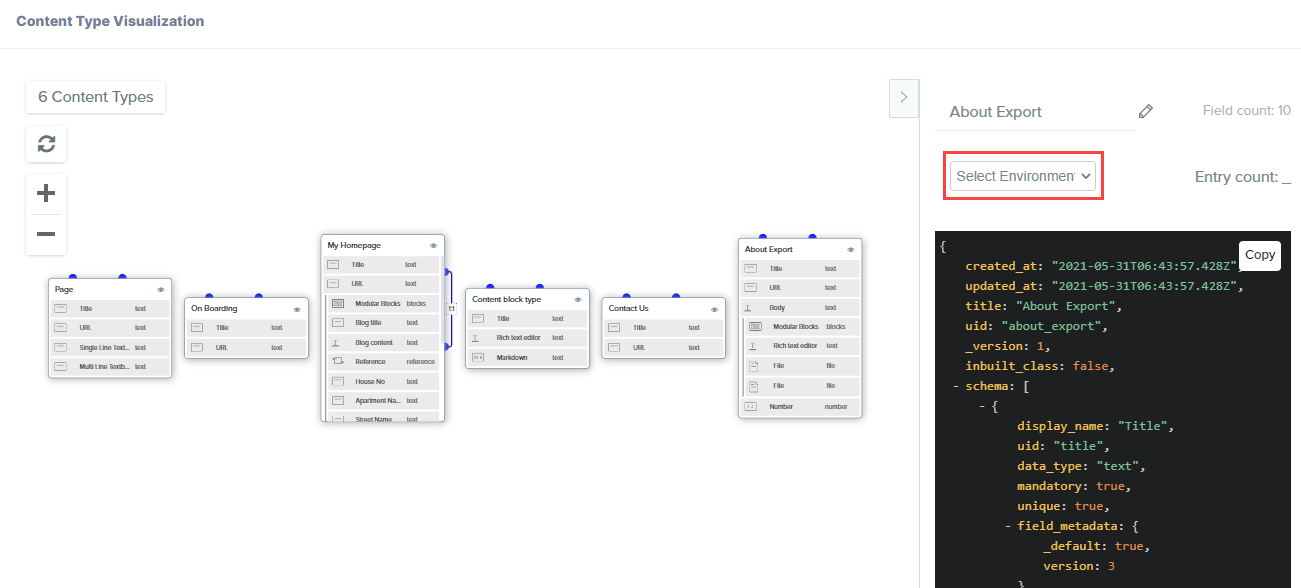
The Select Environment dropdown lists all the environments in your stack. Through this dropdown, you can select the environment, and it gives you the published entry count for that particular environment.
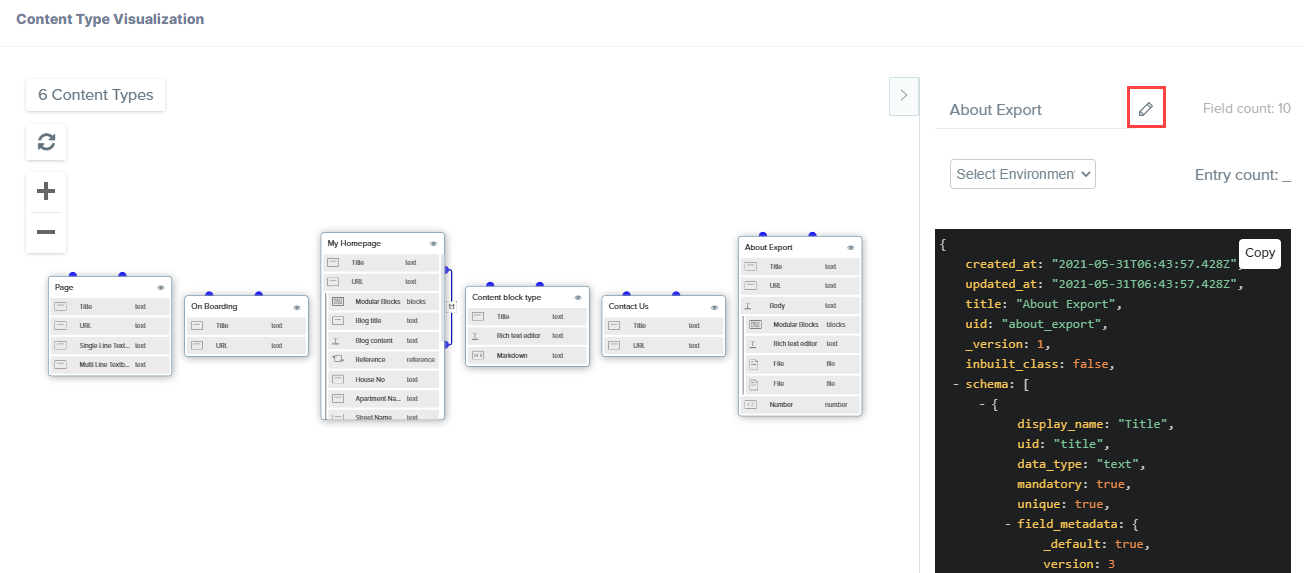
If you click on the pencil icon (as shown in the screenshot below) next to the content type name, you'll be directed to the Content Type Builder page, where you can edit the content type as required.
Was this article helpful?
Thanks for your feedback