Businesses across industries leverage big data to make data-driven decisions, identify new opportunities, and improve overall performance. However, this involves processing petabytes of data. Scaling your servers dynamically to accommodate the variable load can be challenging. Services like Amazon’s Elastic MapReduce (EMR), a managed cluster platform that provides the infrastructure to run and scale big data frameworks such as Apache Spark, Hadoop, Hive, and others, can reduce these operational challenges.
Having this kind of infrastructure certainly puts you in an excellent position to make the most out of the data. While the default configuration and setup is a great start, you can get significant performance gains and optimized results if you fine-tune specific parameters and resources.
At Contentstack, we have been using Apache Spark on AWS EMR for big data analytics. While it does the job well at a reasonable cost, we realized that we could further reduce the processing time, improve the performance, and cut down the associated costs by making a few changes. The article is for the reader who has a basic understanding of Spark and EMR.
Let’s look at the steps we performed to cut down our EMR cost by over 50% by achieving 2x performance improvements:
- Update EMR to the latest version
- Avoid Spark from reading a large GZIP file
- Remove Ignite instance
- Optimize code for MongoDB data storage
- Switch to the optimum AWS instance type
- Reduce the number of instances by load testing
Update EMR to the Latest Version
Until some time ago, we ran EMR version 5.23.0, while the latest version was 6.2.0. However, version 6.2.0 was not supported in the m6gd.16xlarge instance. So, we upgraded to the latest possible version, i.e., 5.33.0. As a result of this change, we moved from Spark version 2.4.0 to 2.4.7, which offered several optimizations made to the Spark engine over time, such as a memory leak fix in 2.4.5, a bug fix in Kafka in 2.4.3, and more.
Avoid Spark From Reading a Large GZIP File
This one step alone has helped us reduce the processing time and improve the performance considerably.
We receive a log of the last 24 hours in a single file compressed in GZIP format every day in Amazon S3. However, you cannot split a GZIP compressed file in Spark. Consequently, a single driver node takes up the file for reading and processing. There is no way to prevent the node from reading the file completely. In the meantime, the rest of the nodes lay idle.
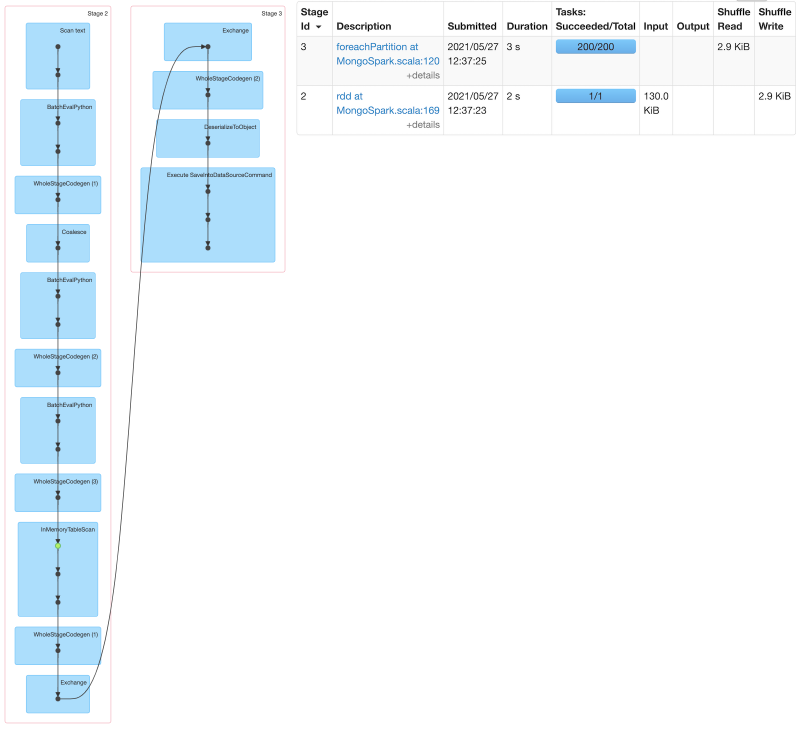
To understand how Spark processes this file, we look at the directed acyclic graph (DAG) to dig deeper into the problem.

As you can see in the above diagram, Stage 2 reads and processes the data, all in a single task because it’s a single GZIP file. This process was taking considerable time. Hence, we decided to make specific changes to the flow.
We decided to split the GZIP file into multiple chunks of data (around 250 MB each) to parallel process multiple tasks. We added a new EC2 c5.xlarge instance which decompresses the GZIP file, splits it into several .log files of about 250MB each, and stores them in S3 with a Time to Live (TTL) of 24 hours. This helped us cut down the waiting time for nodes. Also, instead of six r3.xlarge instances, it’s now just one c5.xlarge that waits for the processed files, so we could also cut down on instance cost.
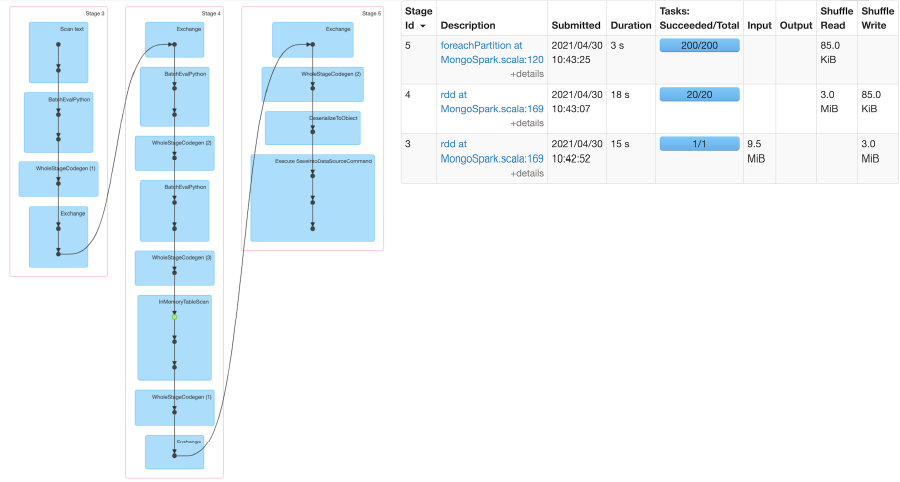
As expected, the results are quite encouraging. The new design now splits the one large GZIP into 20 small files, and all of these are read and processed simultaneously. As you can see in the diagram below, the 20 small files are taken as 20 tasks in Stage 4, thereby reducing the overall processing time.

Remove Ignite Instance
We used an Ignite instance to store the aggregated data from five different log files and later add them to create analytics data. And we used one r3.8xlarge instance for this.
Consequently, you need to process all the log records in sequence. If any job failed due to a corrupted log entry or another reason, we had to reprocess all the jobs and get the aggregated data again.
This reprocessing made us rethink our strategy, and after contemplating some options, we concluded that we might not need an ignite instance. We realized that we could restructure the data stored in the database to run this log file job independently.
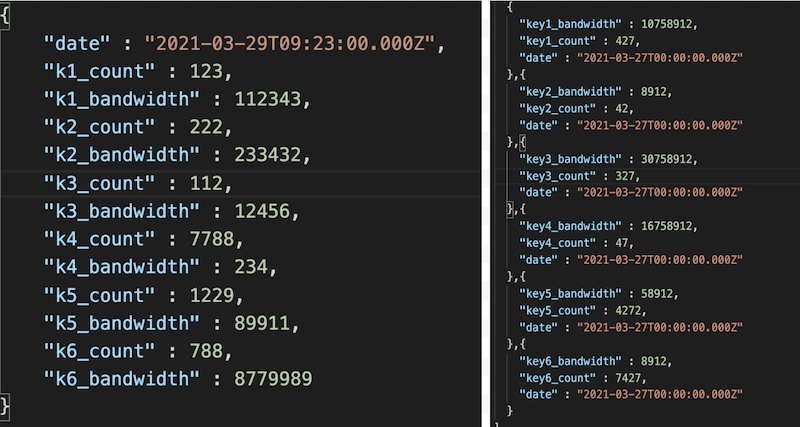
In the image below, the left-hand side represents how we stored data in Ignite for each log (k1) file, and then the aggregated data is saved in MongoDB. The right-hand side data shows the newly restructured JSON that we now store independently after each log processing.

Restructuring the JSON has helped us in the following two ways:
- Run the log processing job independently
- Remove unwanted Ignite instance (r3.8xlarge)
Optimize Code for MongoDB Data Storage
Earlier, we used to run a for-loop on the aggregated data from the Ignite cursor to create JSON data and store it in MongoDB. We do this to keep the JSON data size under 16MB so that we don’t hit the max size limit for the MongoDB document. However, the for-loop function can be run on a single thread at the time in Spark, which practically rendered our 180 parallelisms useless. So, despite having very high parallel-processing capacity, the for-loop was limiting us to using just one thread at a time.
We added some new code, where we used Spark’s inbuilt collect_list to create a JSON array. We then used UDF to split this array into multiple arrays and used explode to create another array of JSON.

These few lines of code helped us eliminate the usage of for-loop and take full advantage of parallelism in Spark.
Switch to the Optimum AWS Instance Type
Until recently, we were using a r3.8xlarge instance type, which provided us 32 vCPUs and 244.0 GiB at $2.66/hour. We looked at the various instance types that AWS provides and found that m6gd.16xlarge was optimal for our use case, which provided 64 vCPUs and 256.0 GiB at $2.89/hour. By just paying $0.23 more per hour, we doubled our vCPUs. This change helped us to optimize our Spark configurations.
The old config is on the left-hand side in the image below, and you can see the new, updated config on the right-hand side.

An essential learning from this exercise is to keep instances updated with optimal core or memory as per the use case.
Reducing the Number of Instances by Load Testing
With the new ETL architecture and changes in instances, it was time to do a load test and determine if we were using the resources optimally.
We started load testing by generating artificial data of a size similar to that of our production.
In the process, we found that we could remove two more instances, apart from the Ignite Instance (1 r3.8xlarge) that we had removed earlier, bringing the total down to three instances (1 master and 2 nodes) on production from six earlier. And the sample data set, which took about 2 hours 3 minutes earlier, now took just about 1 hour 42 minutes.
The Outcome of These Optimization Strategies
We optimized our EMR performance by 2x, thereby reducing the data processing costs by over 50%. And we learned some valuable insights while doing these.
Here is a bulleted list of our learnings:
- To optimize the process, understand how the current engine/system/framework works internally, how it processes data, and with what it is compatible (and not compatible)
- Keep updating your software and systems to the latest versions
- Try to evaluate and optimize your code at regular intervals
- Never use Spark for any task that does not let you use its parallelism feature
- Use DAG to understand how Spark processes your data
- Remove tools or instances if they are not adding any real value
- Perform load testing to assess performance and optimize accordingly
